
Underperforming GA Improvement

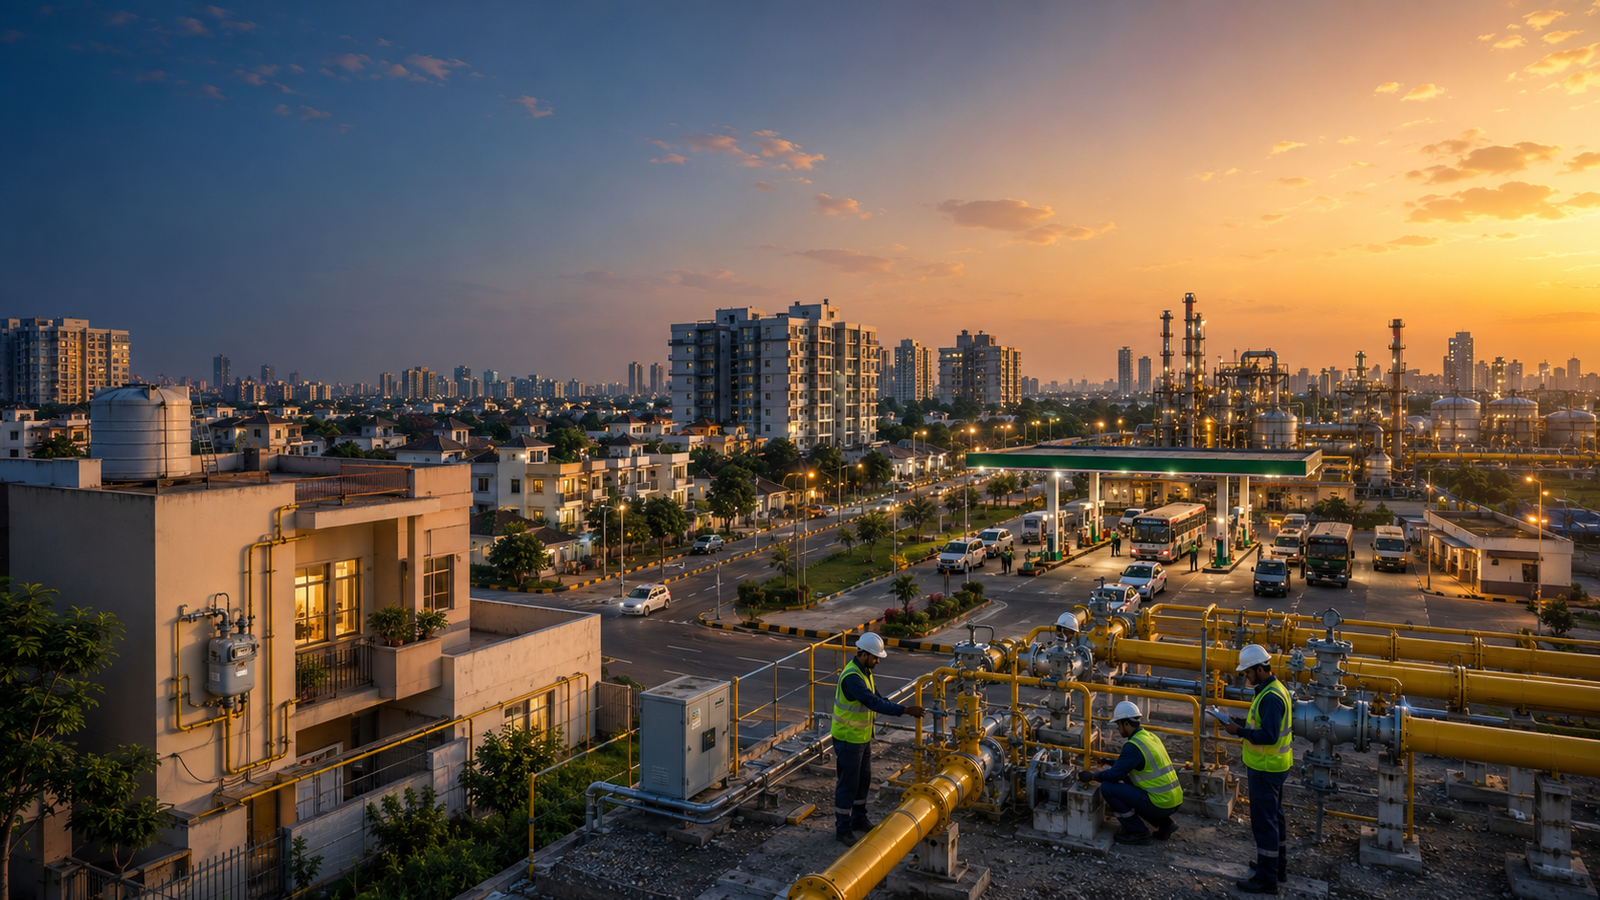
Indian City Gas Distribution network with PNG, CNG, residential, commercial and industrial infrastructure for Gas Area performance improvement
UNDERPERFORMING GA IMPROVEMENT

Turning Underperforming Gas Areas into Stronger CGD Businesses

Diagnose the Gap. Prioritise the Recovery. Improve GA Performance.

FIMPS CGD360 helps CGD organisations identify the structural, commercial, customer and operational factors behind underperformance and develop a practical improvement roadmap for stronger Gas Area performance.

CGD PERFORMANCE
PNG
CNG
NETWORK
CUSTOMER
THE PERFORMANCE GAP

Why Does an Established GA Underperform?

GA underperformance rarely comes from a single issue. Market potential, customer conversion, network utilisation, gas volume, commercial performance and execution can interact to create a persistent performance gap.

01

MARKET

Unrealised demand and weak market penetration.

02

CUSTOMER

Low conversion, connection gaps and inactive customer potential.

03

NETWORK

Limited coverage, weak network utilisation or delayed expansion.

GA PERFORMANCE DIAGNOSTIC
MARKET Demand
↓
CUSTOMER Conversion
↓
NETWORK Utilisation
↓
VOLUME Throughput
↓
COMMERCIAL Contribution
↓
PERFORMANCE GA Outcome
04

VOLUME

Lower PNG and CNG throughput than potential.

05

COMMERCIAL

Segment economics, pricing pressure and weak revenue contribution.

06

EXECUTION

Gaps in project delivery, marketing, operations or customer lifecycle management.

UNDERPERFORMANCE IS A SYSTEM. The objective is to identify the connected gaps before defining the recovery priorities.

GA PERFORMANCE DIAGNOSTIC

A Structured View of GA Performance

Underperformance needs to be measured across the complete CGD ecosystem — not through a single KPI. FIMPS CGD360 examines development, customer segments, network utilisation, gas volumes and commercial performance as connected dimensions of GA performance.

CGD performance diagnostic showing PNG domestic, commercial and industrial customers, CNG infrastructure, gas pipelines and GA performance intelligence
NETWORK ●
PNG / CNG ●
GA PERFORMANCE ●
CGD360 PERFORMANCE LENS

Seven connected diagnostic areas provide a more complete view of where a Gas Area is progressing, underperforming or requiring strategic intervention.

01

MWP & DEVELOPMENT

Infrastructure and development progress against relevant authorised-GA commitments, milestones and targets.

DEVELOPMENT PROGRESS
02

PNG DOMESTIC

Household potential, connection penetration, conversion, activation and the opportunity to deepen residential PNG adoption.

RESIDENTIAL PNG
03

PNG COMMERCIAL

Commercial customer acquisition, segment coverage, demand concentration and potential for higher gas utilisation.

COMMERCIAL PNG
04

PNG INDUSTRIAL

Industrial customer base, volume potential, anchor demand and opportunities for stronger industrial gas utilisation.

INDUSTRIAL PNG
05

CNG

CNG station network, mobility demand, station utilisation, fleet opportunity and potential for CNG growth.

CNG & MOBILITY
06

NETWORK

Pipeline coverage, network utilisation, expansion priorities and infrastructure productivity across the Gas Area.

NETWORK PERFORMANCE
CONNECTED PERFORMANCE VIEW
DEVELOPMENT MWP & GA Progress
CUSTOMERS PNG Segments
NETWORK Coverage & Utilisation
CNG Mobility Demand
GA PERFORMANCE Measurable Outcome
ROOT CAUSE ANALYSIS

Where Is the GA Losing Growth?

Underperformance rarely originates from a single point. FIMPS CGD360 traces the performance journey across demand, customers, network, activation, utilisation and commercial outcomes to identify where growth is being lost.

CGD PERFORMANCE DIAGNOSTIC
ROOT CAUSE / GA LEVEL
01
DEMAND

MARKET POTENTIAL

Is sufficient market demand available within the Gas Area?

02
ACQUISITION

CUSTOMER CONVERSION

Are potential customers being converted into connections?

03
INFRASTRUCTURE

NETWORK COVERAGE

Does network availability support the identified opportunity?

04
ACTIVATION

CONNECTION ACTIVATION

Are installed connections becoming active gas consumers?

05
UTILISATION

GAS VOLUME

Is the connected customer base generating expected gas demand?

06
OUTCOME

COMMERCIAL PERFORMANCE

Does the GA convert its market and infrastructure potential into sustainable business performance?

DIAGNOSTIC PRINCIPLE
DEMAND CUSTOMER ACQUISITION NETWORK CONVERSION ACTIVATION UTILISATION VOLUME COMMERCIAL EXECUTION
NETWORK PERFORMANCE

From Pipeline Infrastructure to Network Utilisation

FIMPS CGD360 evaluates how supply infrastructure, distribution networks, regulation, metering and customer connections work together to influence network utilisation and gas volume.
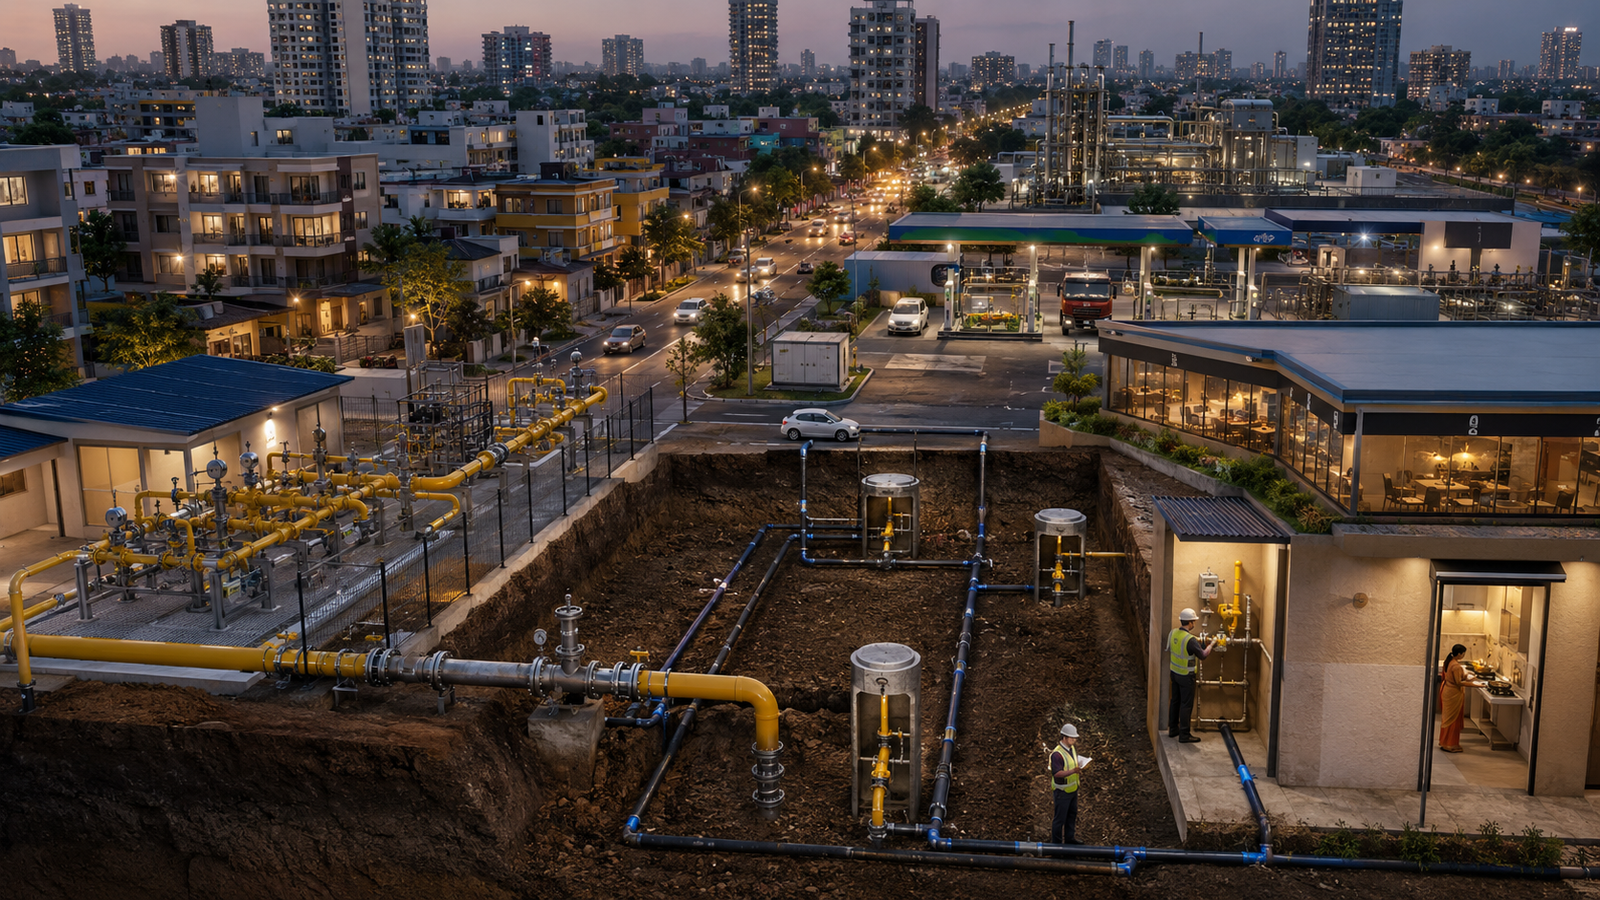
Indian City Gas Distribution network showing City Gate Station, steel pipeline, DRS, MDPE network, domestic, commercial, industrial and CNG connections
CITY GAS DISTRIBUTION NETWORK
CGD INFRASTRUCTURE SUPPLY → DISTRIBUTION → CUSTOMER → GAS VOLUME
CGD NETWORK ARCHITECTURE
01
SUPPLY

CITY GATE STATION

Gas entry, receiving and primary regulation into the CGD system.

→
02
PRIMARY NETWORK

STEEL PIPELINE

High-pressure distribution infrastructure connecting the supply system with the wider Gas Area.

→
03
REGULATION

DISTRICT REGULATING SYSTEM

Pressure regulation and controlled transition into local distribution networks.

→
04
DISTRIBUTION

MDPE NETWORK

Local distribution network extending gas availability across residential and commercial areas.

→
05
CONNECTION

SERVICE & METERING

Service regulation, metering and customer-side connection infrastructure.

→
06
END USE

CUSTOMER

Domestic, commercial and industrial consumers together with CNG mobility demand.

→
07
OUTCOME

GAS VOLUME

Network utilisation reflected through customer activation, demand and gas consumption.

FIMPS PERFORMANCE LENS

Infrastructure alone does not create performance. Utilisation does.

01
NETWORK AVAILABILITY

Coverage, connectivity and infrastructure readiness across the GA.

02
NETWORK UTILISATION

Relationship between available infrastructure and actual demand.

03
CUSTOMER ACTIVATION

Conversion of installed connections into active gas consumers.

04
GAS VOLUME

Demand and consumption generated across PNG, CNG and customer segments.

CUSTOMER CONVERSION & PENETRATION

Turning Network Availability into Customer Growth

Network availability creates the opportunity. Sustainable GA growth depends on converting that opportunity into connected, activated and consistently consuming customers.

CGD CUSTOMER LIFECYCLE
POTENTIAL → CONSUMPTION
01
OPPORTUNITY

POTENTIAL

Locate high-potential residential, commercial and other customer clusters within the networkable area.

02
ACQUISITION

REGISTRATION

Improve customer outreach, registration momentum and movement from identified opportunity into formal demand.

03
CONVERSION

CONNECTION

Reduce installation and connection delays so registered customers move efficiently into the connected customer base.

04
CONSUMER START

ACTIVATION

Move connected customers towards active gas usage and reduce inactive or non-consuming connections.

05
UTILISATION

CONSUMPTION

Strengthen gas utilisation across customer segments and support sustainable PNG demand and volume growth.

06
LIFECYCLE

RETENTION

Strengthen customer lifecycle management, consumption continuity and long-term customer value.

01 IDENTIFY High-potential clusters
02 CONVERT Registration to connection
03 CONNECT Installation completion
04 ACTIVATE Connected to consuming
05 RETAIN Lifecycle and consumption
REGULATORY & PERFORMANCE READINESS

Aligning GA Performance with Its Regulatory and Development Context

FIMPS CGD360 helps organisations assess Gas Area performance against relevant regulatory, development, infrastructure and service-quality considerations and identify areas requiring management attention.
STRATEGIC ASSESSMENT & IMPROVEMENT SUPPORT
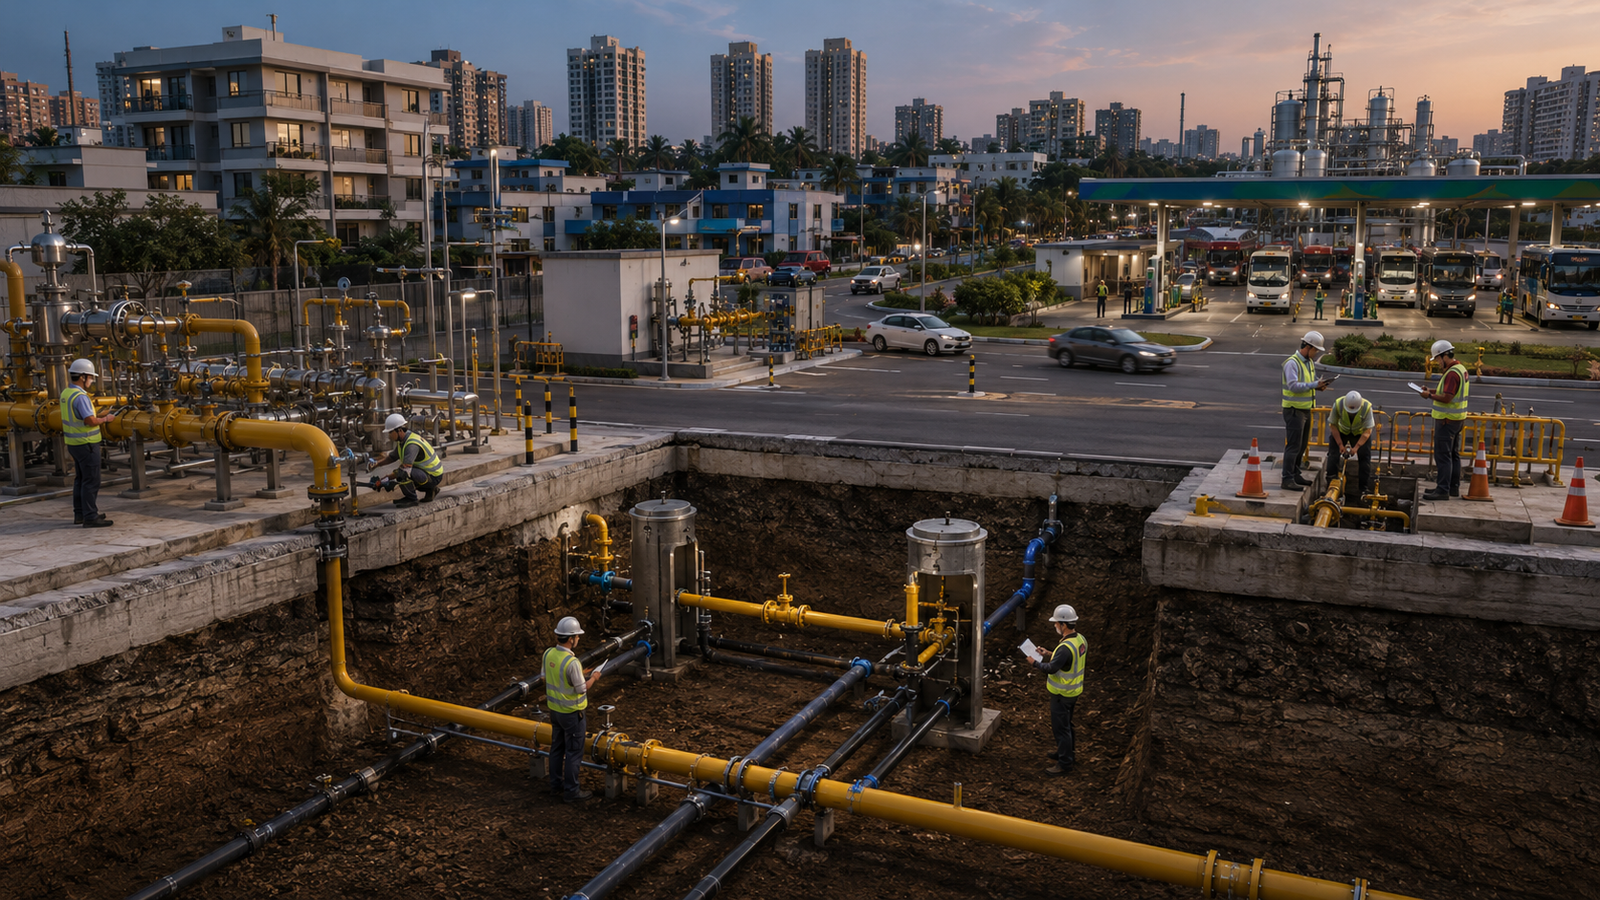
Indian City Gas Distribution network showing regulatory, technical, safety, integrity, capacity and performance assessment environment
CGD PERFORMANCE READINESS
GAS AREA MANAGEMENT VIEW INFRASTRUCTURE · SERVICE · SAFETY · INTEGRITY · CAPACITY · PERFORMANCE
FIMPS ASSESSMENT FRAMEWORK

Six dimensions for a connected GA performance review.

The objective is not regulatory certification. It is to create management-level visibility around relevant requirements, development progress, infrastructure performance and areas that may require further review.

01
DEVELOPMENT

MWP / DEVELOPMENT TARGETS

Track relevant infrastructure and connection-development progress against applicable GA commitments, targets and development priorities.

02
SERVICE

SERVICE QUALITY

Review customer-service performance and relevant service obligations across the Gas Area.

03
TECHNICAL & SAFETY

TECHNICAL & SAFETY

Consider relevant T4S requirements and safety-related performance areas within the CGD operating environment.

04
INTEGRITY

INTEGRITY MANAGEMENT

Consider infrastructure integrity-management requirements and management attention areas affecting the CGD network.

05
NETWORK

CAPACITY & UTILISATION

Assess network capacity, utilisation and infrastructure considerations in relation to current and potential demand.

06
MANAGEMENT

PERFORMANCE REVIEW

Create management-level visibility around GA progress, performance gaps, development priorities and areas requiring further action.

STRATEGIC ASSESSMENT — NOT REGULATORY CERTIFICATION

FIMPS CGD360 provides strategic assessment and improvement perspectives. Regulatory interpretation, statutory compliance, certification and approvals remain subject to the applicable regulations, authorised entities and competent authorities.

GA RECOVERY FRAMEWORK

From Performance Gap to Recovery Roadmap

FIMPS CGD360 connects structured diagnosis with focused intervention, measurable improvement and continuous performance management across the Gas Area.

CGD PERFORMANCE RECOVERY MODEL
DIAGNOSE → SUSTAIN
01
PERFORMANCE GAP

DIAGNOSE

Understand the current performance gap across market, customer, network, volume and commercial dimensions.

02
ROOT CAUSE

IDENTIFY

Find the underlying causes affecting customer conversion, network utilisation, activation, demand or commercial outcomes.

03
FOCUS

PRIORITISE

Determine the highest-impact interventions based on opportunity, performance gap, feasibility and expected business impact.

04
ACTION

INTERVENE

Implement focused commercial, customer, network or operational initiatives aligned with the identified recovery priorities.

05
PERFORMANCE

MEASURE

Track measurable changes in customer growth, network utilisation, gas volume and commercial performance.

06
CONTINUOUS MANAGEMENT

SUSTAIN

Establish continuous performance management so improvements are maintained and new performance gaps are identified early.

RECOVERY OUTCOME
PERFORMANCE GAP → FOCUSED ACTION → MEASURABLE IMPROVEMENT → SUSTAINED GA PERFORMANCE